Line · Scatter · Linear fit
Find the signal
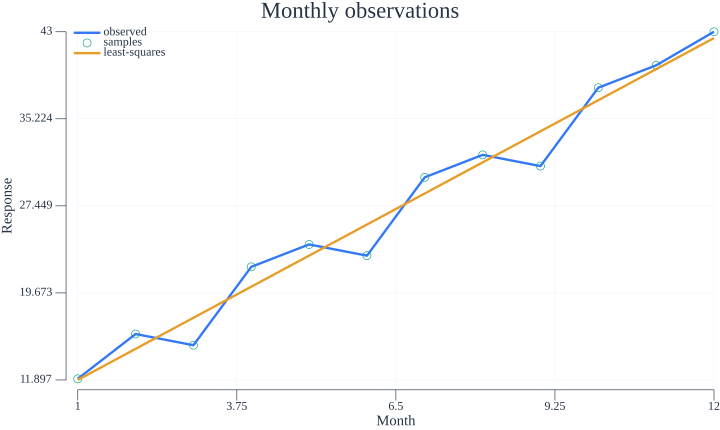
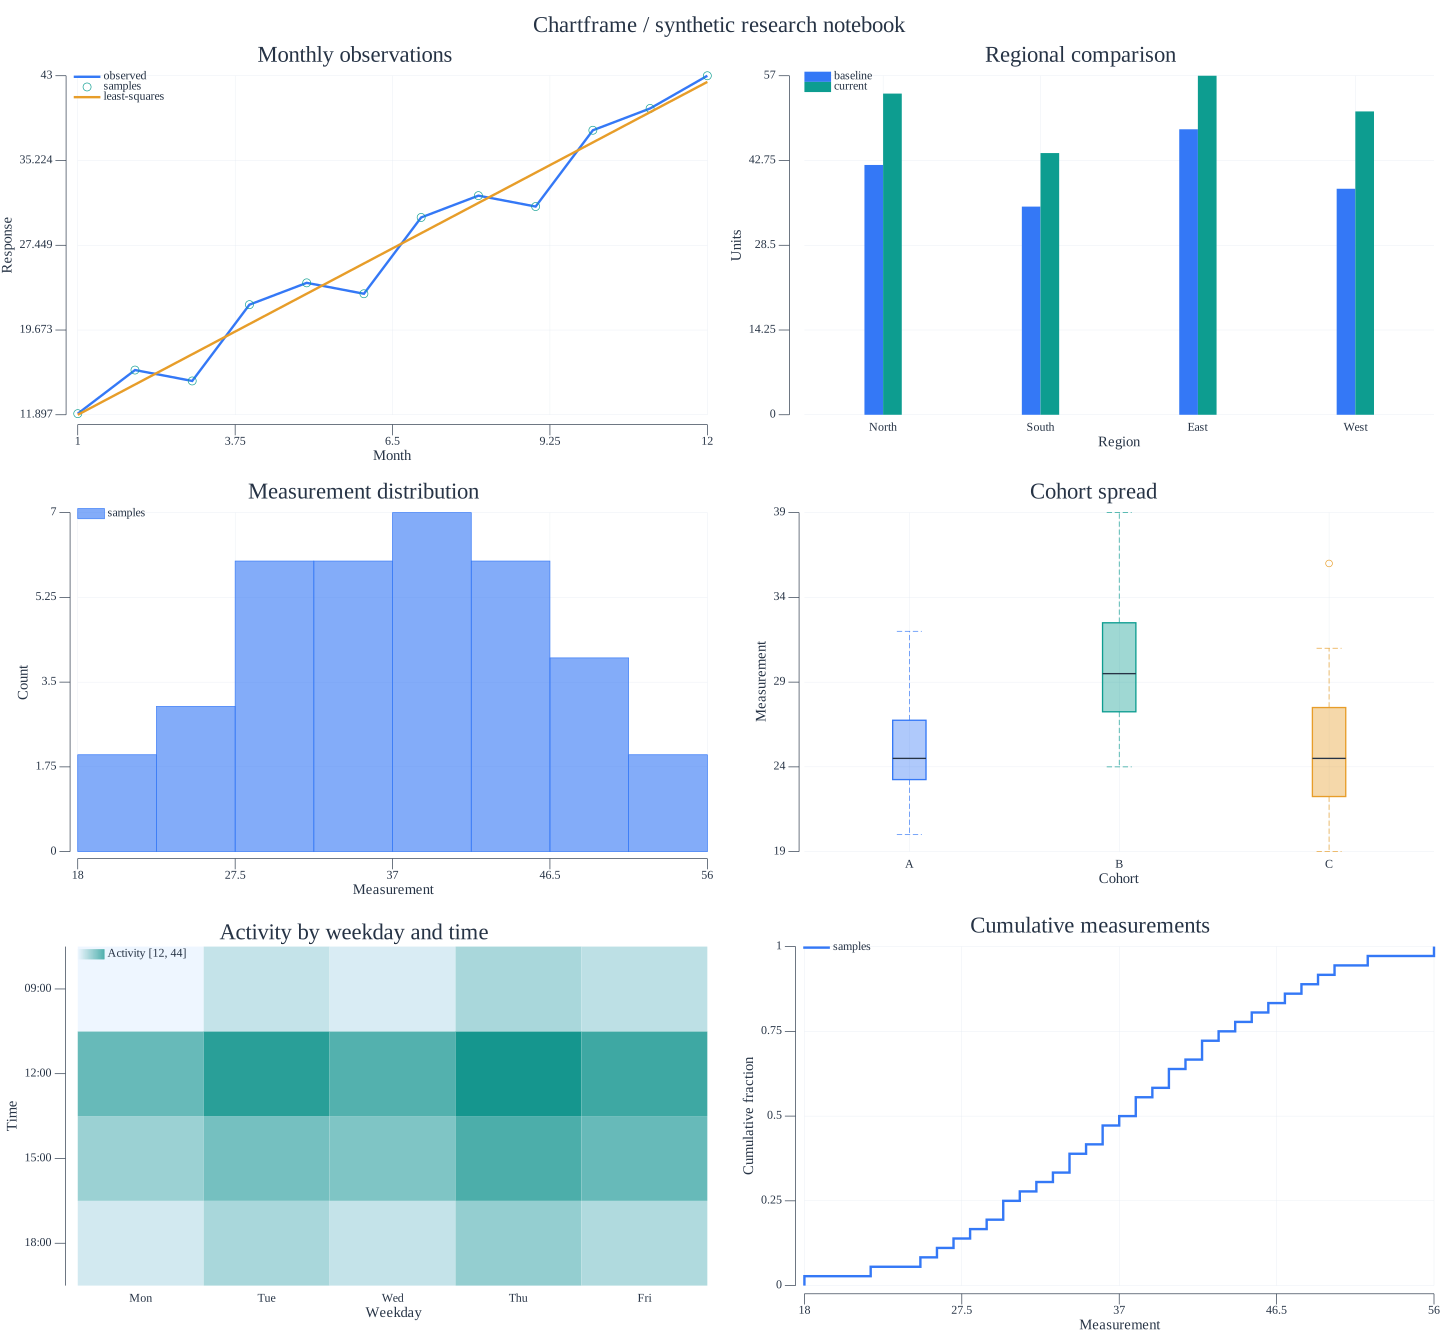
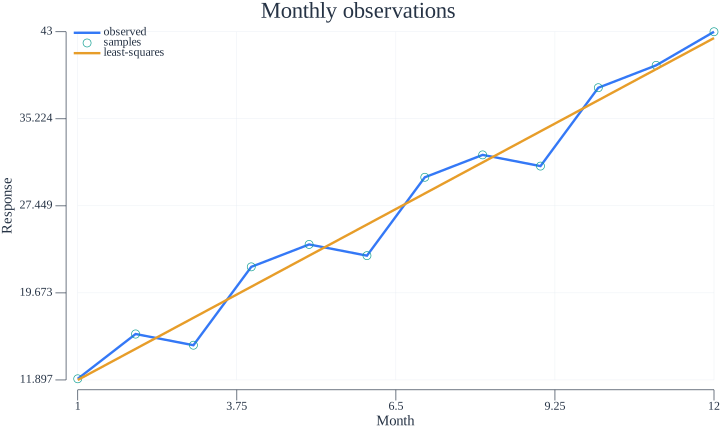
Monthly observations, their connected path, and an ordinary least-squares fit. Synthetic values show a gradual upward trend.
View runnable Go example
package main

import (
	cf "github.com/Alifarid0011/chartframe"
	"log"
)

func main() {
	x := []float64{1, 2, 3, 4, 5, 6, 7, 8, 9, 10, 11, 12}
	y := []float64{12, 16, 15, 22, 24, 23, 30, 32, 31, 38, 40, 43}
	c := cf.New("Monthly observations").
		Line("observed", x, y).
		Scatter("samples", x, y).
		LinearFit("least-squares", x, y).
		Labels("Month", "Response")
	if err := c.Save("trend.svg"); err != nil {
		log.Fatal(err)
	}
}